Understanding the Impact of an Inverted Yield Curve on Investments
Written on
Chapter 1: The Yield Curve Explained
If you've tuned into financial news lately, particularly on networks like CNBC or Bloomberg, you've likely heard frequent discussions regarding the yield curve. Recently, a segment of this curve has inverted, sparking considerable debate within financial circles. Historically, an inverted yield curve has accurately forecasted the last seven recessions, making it a crucial leading indicator of economic health that investors closely monitor.

The Historical Context of Yield Curve Inversions
As illustrated in the accompanying chart, every instance when the 2-year and 10-year yields have inverted has been followed by a recession within 12 to 18 months. This raises the question: will history repeat itself?
In this discussion, I will cover three main topics:
- What is the yield curve and what does a typical healthy curve look like?
- Is this inversion a significant concern?
- What strategies might be wise if we enter a recession?
What is the Yield Curve?
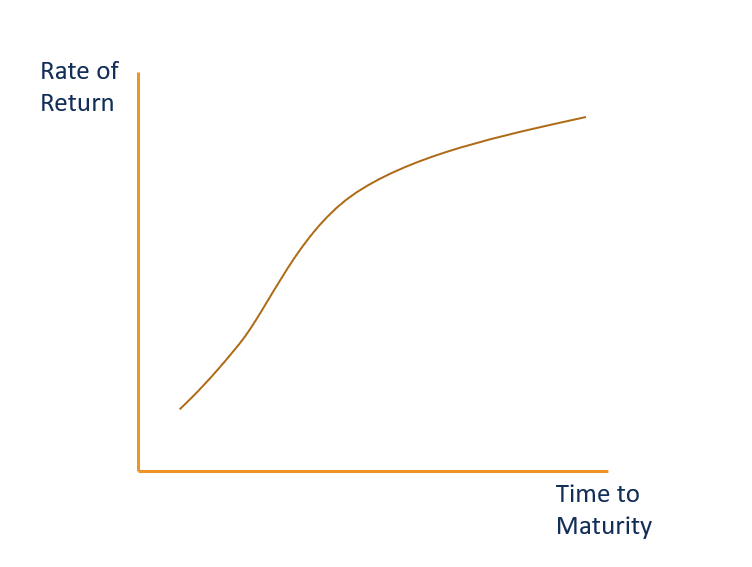
Essentially, the yield curve is a graphical representation of interest rates on government bonds across various maturities. A healthy yield curve typically has a positive slope, indicating that longer-term investments should yield higher returns than shorter-term ones. The rationale behind this is straightforward: as the lending period extends, so does the risk and opportunity cost for the lender.
Consider this analogy: if you lend your friend Alex $100, would you expect a higher return if he repays you in a month or after five years? Naturally, the longer period entails greater risk, thus justifying a higher return. This principle applies similarly to government bonds, where a 10-year bond should offer a better return than a 2-year note.
Chapter 2: Assessing the Inversion's Significance
Understanding the Implications of Inversion
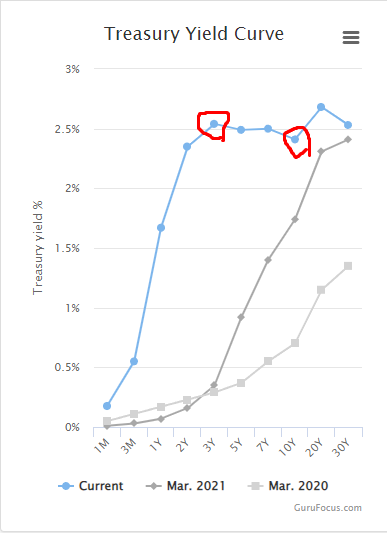
We must consider what it means when the yield curve inverts. This phenomenon indicates that short-term interest rates exceed long-term rates. The underlying belief here is that long-term rates are expected to decline, often a signal of anticipated deflation or recession—an outlook that the bond market is communicating.
I have prepared a brief video that delves deeper into this subject. Check it out below for more insights.
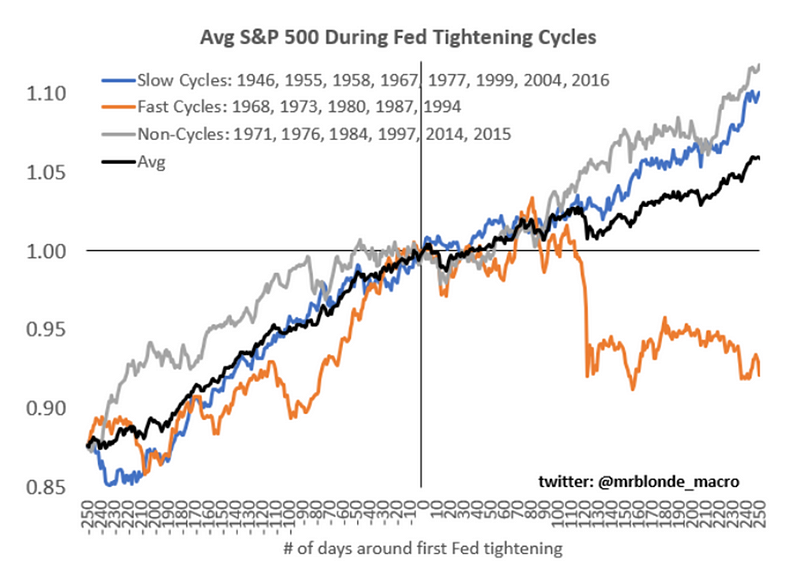
However, how serious is this situation? Much hinges on the actions of the Federal Reserve, particularly the pace of their tightening cycle and their ability to navigate toward a "soft landing." Rapid tightening cycles have historically led to significant downturns in equity markets, as evidenced by the cycles in 1968, 1997, and 2015.
Potential Investment Strategies
If we indeed face a swift tightening cycle that leads to a complete inversion of the yield curve, two sectors are likely to suffer: financial institutions and high-yield junk bonds.
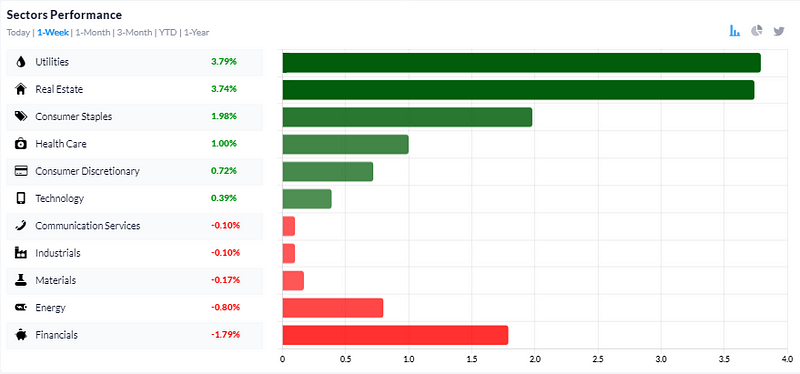
- Financial Institutions: Banks typically borrow at short-term rates and lend at long-term rates (e.g., mortgages, car loans). An inverted yield curve compresses their margins, causing financial stocks to underperform. Recent sector performance indicates that financials have lagged behind others significantly.
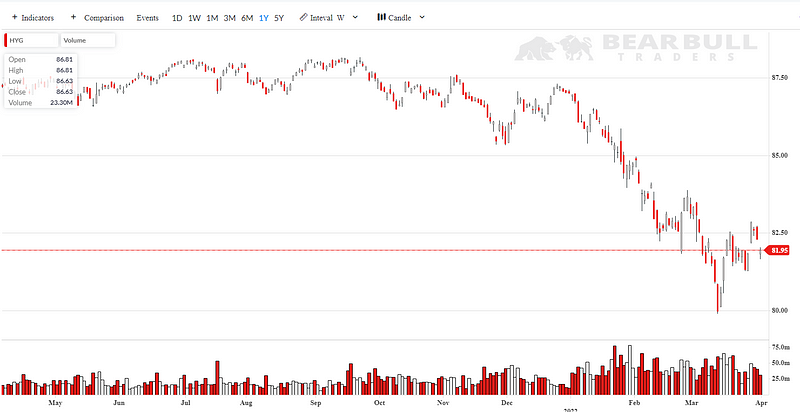
- Junk Bonds: As interest rates rise and financing conditions tighten, expect to see an increase in junk bond spreads, leading to declines in ETFs tracking these bonds.
Conclusion: The Current Economic Landscape
While concerning, the current yield curve inversion shouldn't be overstated. The economy remains resilient, and the job market appears strong. If the inversion persists and economic conditions deteriorate, it may indicate an approaching recession, leading to market sell-offs. However, for now, equities and stocks still show potential.
Stay Connected
I hope this article has provided valuable insights into the subject. Feel free to explore more of my work or connect with me for updates. You can follow me on Medium, check my books on Amazon, join me on LinkedIn, or subscribe to my YouTube channel for daily market insights.